Measures of Central Tendency in Data Analysis: Mean, Median, and Mode Explained
Measures of Central Tendency in Data Analysis: Mean, Median, and Mode Explained
What You Will Learn
- Why data summarization is important in data analysis
- What measures of central tendency are and why they matter
- How to calculate mean, median, and mode
- When each measure is most useful in practice
- How outliers affect the mean and why the median can be more reliable
- Why the mode is useful for both numeric and categorical data
- How to compare mean, median, and mode using real-world examples
- Common mistakes beginners make when choosing a central tendency measure
In the previous article, What Is Descriptive Statistics and Why It Matters in Data Analysis (With Real-Life Examples), we looked at how descriptive statistics helps organize and summarize raw data. Measures of central tendency are one of the most important parts of that process because they help answer a simple question: what is a typical value in this dataset?
Raw data is often difficult to understand at a glance. A spreadsheet with hundreds or thousands of values may contain useful information, but patterns are not always obvious. Data summarization helps reduce complexity so analysts can quickly spot trends, compare groups, and communicate findings clearly.
Among the most common summary tools are the mean, median, and mode. These three measures describe the center of a dataset in different ways. For beginners, learning these concepts is essential because they appear everywhere in analytics, business reporting, research, and everyday decision making.
Introduction to Data Summarization
Data summarization is the process of turning a large collection of raw observations into smaller, more understandable insights. Instead of reading every value one by one, analysts use summary statistics and charts to understand what the data is saying.
Imagine a store owner reviewing one year of daily sales numbers. Looking at all 365 values separately would be slow and confusing. A summary such as the average sale amount, the middle sale value, or the most common purchase category gives a much faster understanding of business performance.
This is why summarization matters. It helps people move from raw numbers to useful interpretation.
What Are Measures of Central Tendency
Measures of central tendency are statistical techniques used to identify the center or typical value of a dataset. In simple terms, they answer questions like:
- What is the average value?
- What value sits in the middle?
- What value appears most often?
These measures simplify data analysis by giving a compact description of where data is concentrated. Instead of talking about every value, analysts can talk about one representative number.
Why Central Tendency Matters in Data Analysis
Measures of central tendency are useful because they help analysts understand datasets quickly. They are often used to:
- Summarize large sets of data with a single value
- Compare one group to another
- Support decisions in business, healthcare, education, and finance
- Detect whether a dataset may contain unusual values
For example, a company may compare the average order value between two months. A school may look at the median exam score to understand typical student performance. A retailer may use the mode to find the most popular product size.
Overview of Mean, Median, and Mode
The three main measures of central tendency are:
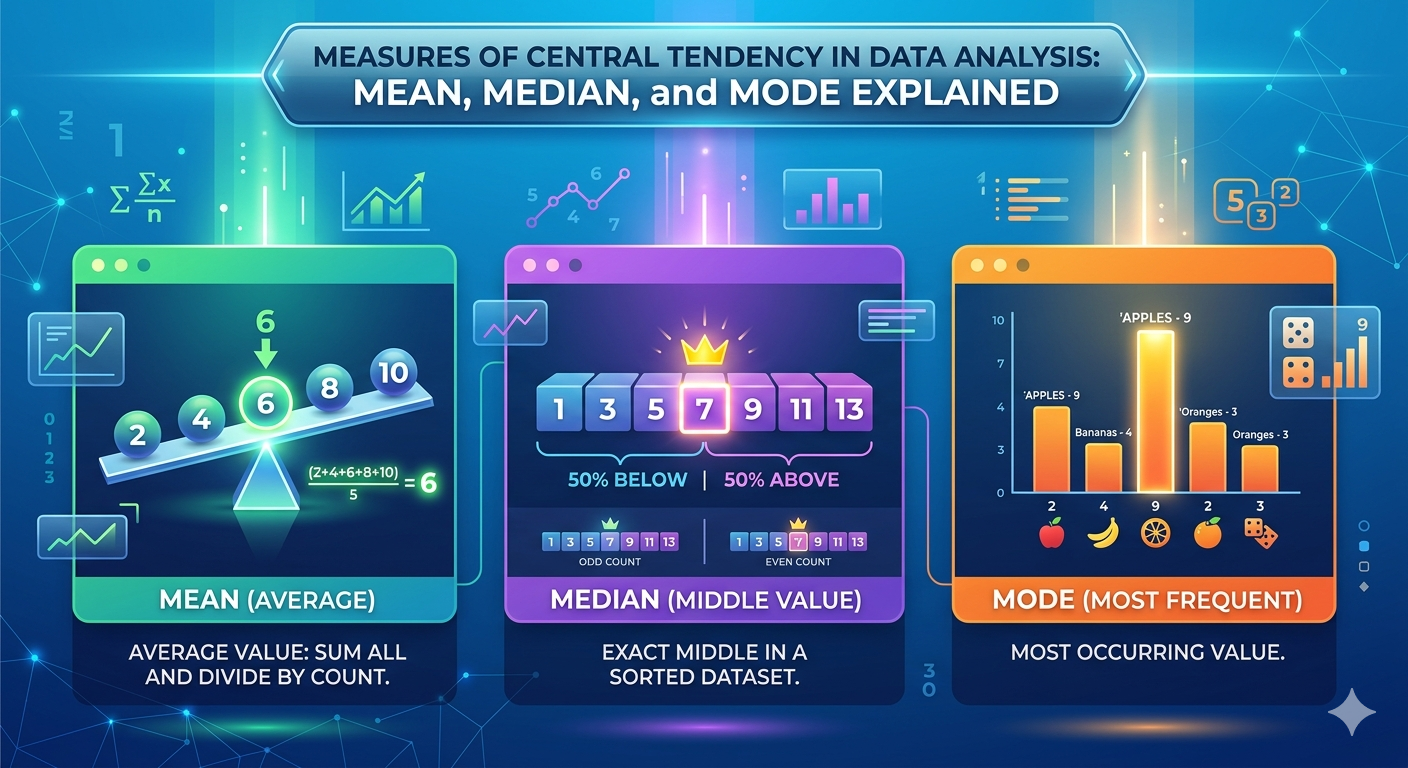
- Mean: the average of all values
- Median: the middle value in sorted data
- Mode: the most frequently occurring value
Each measure is useful in different situations:
- Use the mean when data is fairly balanced and does not contain extreme outliers.
- Use the median when data is skewed or contains very high or very low values.
- Use the mode when you want to know the most common value, especially in categorical data.
Understanding the Mean (Average)
The mean is the sum of all values divided by the number of values. It is the measure most people refer to when they say “average.”
The mathematical formula is:
Mean = (Sum of all values) / (Number of values)
If a dataset contains the values 2, 4, 6, and 8, then:
Mean = (2 + 4 + 6 + 8) / 4 = 20 / 4 = 5
In simple terms, the mean spreads the total amount evenly across all observations.
Python Example: Calculating the Mean
values = [2, 4, 6, 8]
mean = sum(values) / len(values)
print(mean)
Intuition Behind the Mean
A useful way to think about the mean is as the “balance point” of the data. If every value in the dataset were placed on a number line, the mean would be the point where the data balances.
In practical terms, the mean represents what each observation would be if the total were shared equally. That is why it is so common in examples like average income, average test score, or average monthly spending.
Real-Life Example: Calculating Average Monthly Expenses
Suppose a person tracks their monthly expenses for four months:
- January: 900
- February: 1000
- March: 1100
- April: 1000
The mean monthly expense is:
(900 + 1000 + 1100 + 1000) / 4 = 4000 / 4 = 1000
This tells the person that they typically spend about 1000 per month. That is useful for budgeting and planning future expenses.
Python Example: Monthly Expense Average
expenses = [900, 1000, 1100, 1000]
average_expense = sum(expenses) / len(expenses)
print("Average monthly expense:", average_expense)
Advantages of Using the Mean
- It uses every value in the dataset
- It is easy to calculate and understand
- It works well for evenly distributed numeric data
- It is widely used in reporting, analytics, and research
Because the mean includes all values, it gives a complete numerical summary when the data is not heavily distorted by unusual observations.
Limitations of the Mean
The biggest weakness of the mean is that it is sensitive to outliers. An outlier is a value that is much higher or lower than the rest of the dataset.
For example, consider the values 10, 12, 13, 14, and 100. The mean is:
(10 + 12 + 13 + 14 + 100) / 5 = 149 / 5 = 29.8
Even though most values are close to 10 to 14, the mean becomes 29.8 because of the extreme value 100. That makes the average less representative of the typical observation.
Understanding the Median
The median is the middle value in a dataset after the values are sorted in order.
To calculate the median:
- If the dataset has an odd number of values, the median is the middle one.
- If the dataset has an even number of values, the median is the average of the two middle values.
Examples:
- For 3, 5, 7, the median is 5
- For 2, 4, 6, 8, the median is (4 + 6) / 2 = 5
Python Example: Calculating the Median
values = [2, 4, 6, 8]
values.sort()
n = len(values)

if n % 2 == 1:
    median = values[n // 2]
else:
    median = (values[n // 2 - 1] + values[n // 2]) / 2

print(median)
Median and Skewed Data
The median is especially useful when data is skewed or contains outliers. Because it depends on position rather than the exact size of every value, extreme values do not pull it up or down as strongly as they affect the mean.
Using the earlier dataset 10, 12, 13, 14, 100, the median is 13. This is a much better reflection of the typical value than the mean of 29.8.
That is why analysts often prefer the median for income data, house prices, and other real-world datasets where extreme values are common.
Real-Life Example: House Prices
Imagine house prices in a neighborhood are:
- 180,000
- 200,000
- 220,000
- 250,000
- 2,000,000
The mean price is much higher because of the luxury property priced at 2,000,000. But the median is 220,000, which better represents what a typical home costs in that area.
This is why real estate reports often highlight median house price instead of average house price.
Advantages of Using the Median
- It is resistant to extreme values
- It gives a better central value for skewed data
- It is useful in many real-world datasets such as salaries and property prices
- It is simple to interpret as the middle observation
Understanding the Mode
The mode is the value that appears most frequently in a dataset.
For example, in the dataset 1, 2, 2, 3, 4, the mode is 2 because it occurs more often than any other value.
A dataset can have:
- One mode
- More than one mode
- No mode if all values appear the same number of times
Python Example: Finding the Mode
from collections import Counter

values = [1, 2, 2, 3, 4]
counts = Counter(values)
mode = counts.most_common(1)[0][0]
print(mode)
Mode in Categorical Data
The mode is especially useful for categorical data, where mean and median may not make sense. For example, if a survey asks customers for their favorite payment method, the answers might be:
- Cash
- Card
- Card
- Mobile Wallet
- Card
The mode is Card, which tells us the most common customer preference. You cannot calculate a meaningful average from category names, but you can identify the most frequent one.
Real-Life Example: Most Popular Product in a Store
A store may track the sizes of shirts sold in one week:
- Small
- Medium
- Medium
- Large
- Medium
- Large
The mode is Medium. This helps the store understand which size is most popular and plan inventory more effectively.
Comparing Mean, Median, and Mode
Although all three measures describe the center of data, they do not mean the same thing:
- Mean: best for balanced numeric data without major outliers
- Median: best for skewed numeric data or data with outliers
- Mode: best for finding the most common value, especially in categories
Choosing the right one depends on both the type of data and the shape of the distribution.
Real-Life Comparison Example
Consider the dataset:
5, 7, 7, 8, 50
- Mean = (5 + 7 + 7 + 8 + 50) / 5 = 77 / 5 = 15.4
- Median = 7
- Mode = 7
This example shows that the three measures can tell different stories:
- The mean is pulled upward by the outlier 50.
- The median shows the middle of the sorted data.
- The mode shows the most common value.
If you wanted to describe the typical value here, the median or mode would be more useful than the mean.
Choosing the Right Measure in Practice
Analysts choose a central tendency measure based on context. A few practical guidelines are:
- Use the mean for symmetric numeric data with no major outliers.
- Use the median when the data is skewed or when outliers are present.
- Use the mode when you need the most common item or category.
In many cases, it is useful to calculate more than one measure. Looking at mean, median, and mode together often gives a clearer view of the data than relying on a single number.
Common Mistakes When Using Central Tendency
Beginners often make a few common mistakes:
- Using only the mean without checking for outliers
- Ignoring whether the dataset is skewed
- Using the mean for categorical data where it does not make sense
- Assuming one measure is always better than the others
- Forgetting to sort data before finding the median
A good analyst always considers the structure of the data before choosing how to summarize it.
Code Example: Mean, Median, and Mode Together
The following Python example shows a simple way to calculate all three measures for one dataset:
from collections import Counter

values = [5, 7, 7, 8, 50]

# Mean
mean = sum(values) / len(values)

# Median
sorted_values = sorted(values)
n = len(sorted_values)
if n % 2 == 1:
    median = sorted_values[n // 2]
else:
    median = (sorted_values[n // 2 - 1] + sorted_values[n // 2]) / 2

# Mode
counts = Counter(sorted_values)
max_count = max(counts.values())
modes = [value for value, count in counts.items() if count == max_count]

print("Mean:", mean)
print("Median:", median)
print("Mode:", modes)
Summary
Measures of central tendency are foundational tools in descriptive statistics. They help analysts summarize raw data and identify what is typical in a dataset. The mean gives the average, the median gives the middle value, and the mode gives the most frequent value.
Each measure has strengths and weaknesses. The mean works well for balanced numeric data, the median is better for skewed data and outliers, and the mode is valuable for both numeric and categorical data. Understanding when to use each one is an important skill for anyone starting in data analysis.
As part of descriptive statistics, these measures make data easier to understand, compare, and communicate. However, they describe existing data rather than predict future outcomes, which is an important distinction for beginners.
Conclusion
Mean, median, and mode are simple concepts, but they are extremely powerful in practice. They help turn large collections of values into clear insights that support better understanding and better decisions.
As you continue learning data analysis, make it a habit to ask not just “what is the average?” but also “is the data skewed?” and “what value is most common?” That mindset will help you choose the right measure for the situation and produce more accurate interpretations.
In the broader context of descriptive statistics, central tendency is one of the first and most important tools you will use. Mastering it gives you a strong foundation for exploring spread, distribution, visualization, and more advanced analysis later on.