A Beginner’s Guide to Data Analysis and How to Become a Data Analyst
A Beginner’s Guide to Data Analysis and How to Become a Data Analyst
What You Will Learn
- What data analysis is and why it matters in today’s digital world
- How organizations use data to make better decisions
- What a data analyst does on a daily basis
- The typical workflow of a data analysis project
- The core skills, tools, and technical knowledge beginners should learn
- How Excel, SQL, Python, and visualization tools fit into the job
- Why statistics is essential for interpreting data correctly
- Common beginner challenges and how to overcome them
- A practical roadmap for learning data analysis from zero
- How to build projects, create a portfolio, and prepare for a data analyst career
Introduction to Data Analysis
Data is everywhere. Every website visit, online purchase, mobile app interaction, hospital record, and business transaction creates information. In the modern digital world, organizations collect huge amounts of data every day. The challenge is not only collecting that data, but also understanding what it means.
This is where data analysis becomes important. Companies use data to understand customers, improve products, reduce costs, measure performance, and predict future trends. Instead of relying only on guesswork, businesses increasingly make decisions based on evidence. This is called data-driven decision making.
As a result, data analysis has become one of the most valuable skills in many industries. Whether you want to work in business, technology, healthcare, finance, or marketing, learning how to analyze data can open many career opportunities.
What Is Data Analysis
Data analysis is the process of inspecting, cleaning, transforming, and interpreting data to find useful information. The goal is to discover patterns, answer questions, and support better decisions.
In simple terms, data analysis means taking raw data and turning it into something meaningful. Raw data is often messy, incomplete, or hard to understand. A data analyst organizes that data, checks for errors, explores trends, and presents clear insights.
For example, a company may have a large table of sales records. On its own, that table may not tell a clear story. But after analysis, the business may learn which products sell best, which months have the highest revenue, and which customer groups are most valuable.
Why Data Analysis Is Important
Data analysis helps organizations make smarter and faster decisions. Instead of making assumptions, decision makers can use real evidence. This reduces uncertainty and improves outcomes.
- Improve business decisions by using facts instead of guesswork
- Optimize internal processes and reduce inefficiency
- Understand customer behavior and preferences
- Measure performance and identify weak areas
- Predict trends and prepare for future demand
- Reduce risk by spotting unusual patterns or warning signs
For example, a store can analyze sales data to know which products should be stocked more often. A marketing team can analyze campaign performance to see which ads generate the most conversions. A bank can analyze transactions to detect fraud.
Who Uses Data Analysis and Why
Data analysis is used in many industries because almost every field now depends on digital information.
Business
Businesses use data analysis to track revenue, measure team performance, improve operations, and support strategic planning.
Healthcare
Hospitals and healthcare providers analyze patient records, treatment outcomes, and operational data to improve care and efficiency.
Finance
Banks and financial institutions use data analysis for risk management, fraud detection, customer segmentation, and investment decisions.
Marketing
Marketing teams analyze campaign results, website traffic, customer engagement, and conversion data to improve targeting and return on investment.
E-commerce
Online stores use data to understand purchasing behavior, recommend products, optimize pricing, and manage inventory.
Government
Governments use data analysis for public policy, population studies, budgeting, transportation planning, and public service improvement.
Technology Companies
Tech companies analyze product usage, user behavior, system performance, and customer feedback to improve software and services.
What Does a Data Analyst Do
A data analyst works with data to answer questions and provide insights. The exact job may vary by company, but the core responsibilities are similar.
- Collect data from files, spreadsheets, databases, APIs, or other sources
- Clean and prepare datasets by fixing missing values, duplicates, and formatting issues
- Explore the data to find trends, patterns, and unusual values
- Analyze information to answer business questions
- Create charts, dashboards, and reports
- Present findings to managers, teams, or clients
- Support decision making with clear and practical recommendations
A good data analyst does not only work with numbers. They also communicate clearly and explain what the numbers mean.
The Data Analysis Workflow
Most data analysis projects follow a structured workflow. Learning this process helps beginners understand how analysts turn raw information into insights.
1. Data Collection
The first step is gathering data from relevant sources. This may include databases, spreadsheets, web analytics platforms, surveys, or application logs.
2. Data Cleaning
Real-world data is often messy. Analysts remove duplicates, fix errors, standardize formats, and handle missing values.
3. Data Exploration
Analysts examine the dataset to understand its structure, key variables, ranges, and basic patterns. This step often includes summary statistics and simple charts.
4. Analysis
In this stage, the analyst answers specific questions. For example, which product category drives the most revenue, or which marketing channel brings the highest number of customers?
5. Visualization
Charts and dashboards make it easier to communicate findings. Good visualizations help people understand trends quickly.
6. Communication of Insights
The final step is presenting results in a useful way. Analysts explain what they found, why it matters, and what action should be taken.
Skills Every Data Analyst Should Have
To become a data analyst, beginners should develop both technical and non-technical skills.
- Analytical thinking
- Problem solving
- Attention to detail
- Communication skills
- Curiosity and willingness to ask questions
- Basic statistics knowledge
- Comfort working with spreadsheets, databases, and code
Technical skills help you work with data, but soft skills help you understand the business problem and explain your results to others.
Technical Knowledge Required for Data Analysis
Beginners do not need to learn everything at once, but they should understand a few core technical topics.
- Basic statistics such as averages, percentages, distributions, and correlation
- Data cleaning methods for fixing errors and preparing datasets
- Data visualization concepts such as choosing the right chart
- Structured data concepts like rows, columns, tables, and relationships
- Basic understanding of databases and query logic
This foundation makes it much easier to learn tools like SQL, Python, Power BI, and Tableau later.
Programming Languages Used in Data Analysis
Programming is useful in data analysis because it helps automate repetitive tasks, process large datasets, and perform more advanced analysis.
The most common languages in the field are Python and R. For beginners, Python is often the most practical starting point because it is beginner-friendly and widely used across data analysis, automation, machine learning, and web applications.
Even if you start with spreadsheets and SQL, learning a programming language will help you grow into more advanced work.
Common Tools Used in Data Analysis
Data analysts use different tools depending on the type of work and the size of the data.
- Microsoft Excel for basic analysis and reporting
- Google Sheets for collaborative spreadsheet work
- SQL for querying data from databases
- Python for cleaning, automation, and advanced analysis
- Tableau for interactive dashboards
- Power BI for business reporting and data visualization
- Jupyter Notebook for interactive Python analysis
You do not need to master all tools at the beginning. Start with the basics and build step by step.
Spreadsheet Tools for Data Analysis
Spreadsheet tools like Microsoft Excel and Google Sheets are often the first tools beginners learn. They are useful for small datasets, quick calculations, filtering, sorting, creating charts, and simple reporting.
Spreadsheets help beginners understand core ideas like formulas, pivot tables, lookup functions, and basic visualization. They are especially useful in business settings where teams often share reports in spreadsheet format.
However, spreadsheets become less efficient when datasets grow large or analysis becomes more complex. That is why analysts eventually learn SQL and Python.
SQL for Data Querying
SQL stands for Structured Query Language. It is used to retrieve and work with data stored in relational databases. SQL is one of the most important skills for data analysts because much of the world’s business data lives in databases.
With SQL, analysts can filter records, join tables, group data, and calculate metrics directly from the source.
Here is a simple SQL example that calculates total sales by product category:
SELECT category, SUM(sales_amount) AS total_sales
FROM orders
GROUP BY category
ORDER BY total_sales DESC;
This query groups records by category and shows which category generated the highest sales.
Python for Data Analysis
Python is widely used in data analysis because it is easy to read and has powerful libraries. Three common libraries are:
- pandas for data cleaning and manipulation
- numpy for numerical operations
- matplotlib for charts and visualizations
Here is a simple Python example that reads a CSV file and shows average sales by region:
import pandas as pd

sales = pd.read_csv("sales.csv")
summary = sales.groupby("region")["sales_amount"].mean()
print(summary)
This example shows how quickly Python can summarize data. As your skills improve, you can use Python for automation, advanced visualizations, and larger datasets.
Data Visualization Tools
Visualization tools help analysts turn raw numbers into understandable charts, reports, and dashboards. Two of the most popular tools are Power BI and Tableau.
These tools allow analysts to build interactive dashboards where users can filter data, compare trends, and monitor business performance. Visualizations are important because decision makers often understand charts faster than tables of numbers.
Common chart types include bar charts, line charts, pie charts, scatter plots, and maps. A good analyst also knows when not to use a chart that may confuse the audience.
Statistics in Data Analysis
Statistics helps analysts interpret data correctly. Without statistical understanding, it is easy to misread patterns or draw false conclusions.
Important beginner topics include:
- Mean, median, and mode
- Range and standard deviation
- Percentages and proportions
- Correlation
- Sampling
- Probability basics
You do not need advanced mathematics at the beginning, but you should understand enough statistics to ask good questions and avoid misleading interpretations.
What Beginners Often Struggle With
Learning data analysis can feel overwhelming at first. Many beginners face similar challenges.
- Statistics may seem abstract or difficult
- Real-world data is often messy and incomplete
- Programming can be frustrating in the beginning
- It can be hard to know which tool to learn first
- Interpreting results correctly takes practice
- Turning analysis into useful business insights is not always easy
The best way to improve is through practice. Start small, repeat common tasks, and focus on understanding the basics before moving to advanced topics.
How to Start Learning Data Analysis from Zero
A simple learning path can make the process easier. Here is a practical order for beginners:
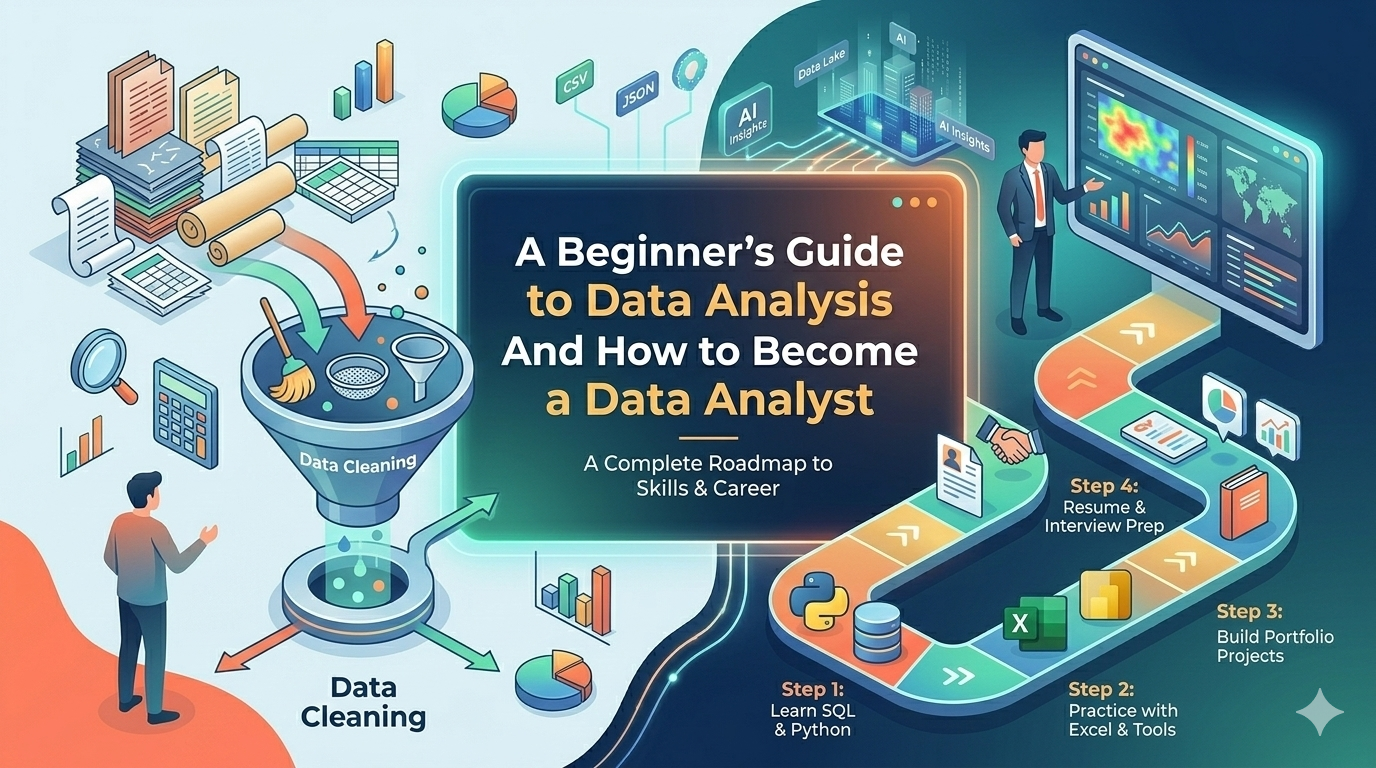
Step 1: Learn Spreadsheet Basics
Start with Excel or Google Sheets. Learn formulas, sorting, filtering, charts, and pivot tables.
Step 2: Learn SQL
Understand how to query data from tables, filter records, group results, and join data from multiple sources.
Step 3: Learn Python
Use Python to clean data, automate tasks, and analyze larger datasets more efficiently.
Step 4: Learn Visualization Tools
Practice creating dashboards in Power BI or Tableau to communicate insights clearly.
Step 5: Study Statistics
Learn the statistical basics needed to interpret data correctly and make reliable conclusions.
This step-by-step approach is easier than trying to learn everything at once.
Building Your First Data Analysis Projects
Projects are one of the most important parts of learning. They help you apply theory, improve problem solving, and build confidence.
Good beginner project ideas include:
- Analyzing monthly sales data to find top-performing products
- Studying website traffic to identify popular pages and visitor trends
- Reviewing survey responses to summarize customer opinions
- Comparing product categories by revenue or profit
- Cleaning a messy public dataset and creating a simple dashboard
Use real datasets from public sources when possible. Focus on asking a clear question, cleaning the data, analyzing it, and presenting your findings in a readable way.
Creating a Data Analyst Portfolio
A portfolio helps you show employers what you can do. Even if you have no job experience, strong projects can demonstrate your skills.
Your portfolio can include:
- Project descriptions with the business question you solved
- Links to notebooks, SQL queries, spreadsheets, or dashboards
- Visualizations and written explanations of your findings
- A short summary of the tools used in each project
Many beginners use GitHub to share code and notebooks. You can also create a personal website or use portfolio platforms to present your projects more professionally.
Preparing for a Data Analyst Career
To prepare for job opportunities, focus on practical skills and real examples of your work.
- Practice solving data problems regularly
- Learn common industry tools such as Excel, SQL, Python, and Power BI
- Build a portfolio with clear and complete projects
- Improve your communication and presentation skills
- Learn how to explain technical findings in simple business language
- Look for internships, freelance tasks, or volunteer opportunities to gain experience
Interview preparation is also important. Be ready to explain how you cleaned data, why you chose a specific chart, and what conclusions you drew from your analysis.
How to Become a Professional Data Analyst
Becoming a professional data analyst is a long-term process. You start with the basics, build projects, gain experience, and continue learning over time.
As you grow, you may learn more advanced topics such as statistical modeling, A/B testing, forecasting, data warehousing, and machine learning basics. You may also specialize in a particular industry such as finance, healthcare, marketing, or product analytics.
The key is to keep improving through real business problems. Professional analysts do more than use tools. They understand context, ask better questions, and help organizations make important decisions.
Summary
Data analysis is the process of turning raw data into useful insights. It helps organizations make better decisions, improve performance, understand customers, and reduce risk. Data analysts collect, clean, explore, analyze, and present data in a clear way.
Beginners should start with the fundamentals: spreadsheets, SQL, Python, visualization tools, and basic statistics. Practice is essential, especially through real projects that solve meaningful problems. Over time, a strong portfolio and steady learning can lead to a successful data analyst career.
Conclusion
Data analysis is one of the most practical and valuable skills in the modern job market. If you are starting from zero, do not worry about learning everything immediately. Begin with one tool, practice consistently, and build your skills step by step.
Stay curious, work on real datasets, and focus on understanding the story behind the numbers. With patience and regular practice, you can grow from a beginner into a confident and professional data analyst.